


Assessing RBC Deformability

"Please DO Squeeze the RBC..."
Ektacytometry
Ratchet Microfluidic Device
Microfluidic Devices
Mr. George Whipple: Charmin Toilet Paper spokesperson from 1964-1985, 1999-2000 and 2007. Appeared in over 500 unique commercials:
“Please, Don’t Squeeze The Charmin”
Ektacytometry measures deformability by suspending RBC in a viscous solution and applying rotational shear stress such that the normal discoid cells form ellipsoids which is measured by laser. The extent of ellipsoid formation is dependent on the deformability of the sample population. Abnormal RBC can be detected by shifts relative to the scatter intensity pattern of normal cells. Abnormal (i.e., non-deformable) cells can result in any combinations of left or right shifts in response to hypo- or hyper- tonicity, and/or a decrease in the maximum deformation observed under isotonic conditions. Relative to micropipette studies, ektacytometry provided a relative rapid assay to examine RBC. Numerous ektacytometry studies have elucidated the profound influence that mean corpuscular hemoglobin concentration (hence intracellular viscosity), abnormal hemoglobins, cytoskeletal aberrations, drugs and oxidant challenge exert on the cellular deformability. Importantly, ektacytometry only measures the ‘average deformability’ of a cell population and cannot accurately and efficiently quantify the abundance of rigid cells in a bimodal population where both normal and abnormal cells are present. This limitation is, perhaps, the critical failure of ektacytometry because, in many pathologic states, abnormal RBC represent a minor (<10%) fraction of the overall RBC mass hence subtle changes will not be clearly obvious. Moreover, it is difficult to recover RBC subsequent to ektacytometric analysis for further biologic testing as RBC are irreversibly (in most cases) altered by the osmotic gradient employed during the assay.
Cell transit analysis provides information at both the single cell and populational level. To accomplish this, cell transit analysis combines features of both the traditional micropore filtration assay and the micropipette aspiration methodology, in that deformability of each RBC constitutes a single data point and can be used to then generate a populational distribution curve. In a cell transit analyzer, a single RBC passes through a micropore of fixed diameter and length with the transit time (in milliseconds; ms) of the cell calculated using the electrical resistance generated by the RBC within the channel as detected via a conductometer. However, the sensitivity of this method varies with cell size. Smaller cells, even if less deformable, pass through the pores with less resistance. In contrast, abnormally large or rigid cells, which are clinically important, are also be problematic as they block the micropore and are excluded from analysis. Despite these limitations, cell transit analysis is very useful in that it provides subset/heterogeneity analysis via binning of the cells based on the transit time thus providing a continuous measure of the deformability profile of a sample and/or the severity of the deformability defect.
Cell Transit Analysis
While ektacytometry and cell transit analysis have proven very useful as research tools, they have not been used to any great extent clinically. This is in large part due to the expense and complexity of the devices as well as their slow throughput making them impractical for clinical laboratories. Moreover, these in vitro studies often lack biological validation to the very low throughput of the assay (e.g., micropipette aspiration studies), overly small cell numbers, difficulty/impossibility of cell recovery post assessment, or more importantly, an inability to either identify or collect specific sample subsets (e.g., low versus high deformability) following analysis (e.g., Ektacytometry and Cell Transit Analysis studies). Microfluidics approaches potentially offers a cost-effective, high throughput, alternative to assessing blood cell deformability relative to these previous, and now rather ancient (as reflected by the key research papers relating to these approaches) technologies. Deformability measurement using microfluidics uses minute amounts of a whole blood or purified RBC/WBC in suspension flowing through a funnel-shaped micro-constriction(s) in a disposable plate. As demonstrated in our previous publications, and discussed in the following section, microfluidics devices are capable of providing reproducible intra- and inter-individual data, detecting oxidatively damaged RBC, identifying changes in RBC deformability consequent to storage, and identifying leukocytes.
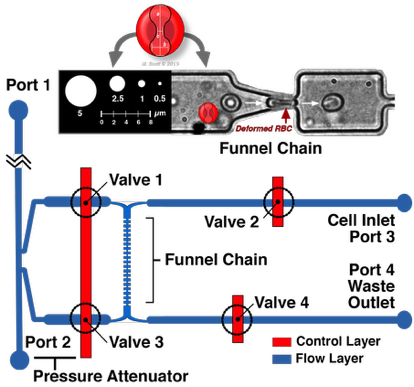
Schematic design of the microfluidic cortical pressure device which utilizes a microfluidic pore funnel chain. The geometry of the pore was approximately 2-2.5 µm wide with a height of 3.15 µm. Valves 1-4 mark the intersection of the control and flow layers, and can be opened and closed to control fluid movement within the flow layer. As a result of the precisely-controlled fluid movement, cells transit through the pores of the funnel chain and their threshold pressure measurements are recorded, and then exit through the Waste Outlet. Shown is an RBC undergoing deformation in a microfluidic channel.
Ratchet Microfluidic Device
Cortical Pressure Device
Our microfluidic work is done in collaboration with
Dr. Hongshen Ma at the University of British Columbia.
Dr. Ma is responsible for the design and manufacturing of the described microfluidic devices.
More information about Dr. Ma can be found at HERE.
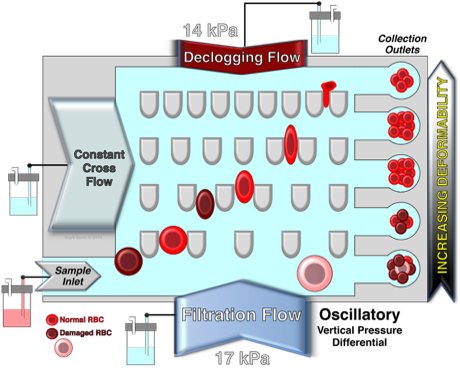
Schematic illustration of the design and principle of the microfluidic ratchet device for the deformability-based separation of RBC and PBMC. The microfluidic sorting region consisting of a 2D array of pillars creating funnel-shaped constrictions with progressively smaller pore sizes from the bottom to the top row. Freshly isolated RBC or PBMC are introduced through the bottom left corner of the sorting region while cells follow a diagonal path under a combined horizontal (a) cross flow and (b) sample inlet flow as well as vertical (c) downward and (d) upward oscillatory flows. As a result, blood cells with different vascular deformability follow a diagonal path through the sorting area until they are individually restricted by different constriction (blocking) pores which subsequently divert cells into specific outlets. Each outlet corresponds to a specific blocking pore size. Specifically, outlets 8-1 corresponds to blocking pore sizes of ≥6.5, 5.5, 4.5, 4.0, 3.5, 3.0, 2.5 and 2.0 µm, respectively. Fluid flow in each inlet is generated by pressurizing the fluid inside the reservoir using adjustable pneumatic pressure (pressure magnitude in red). The net fluid flow is denoted in the upper right corner of the schematic.
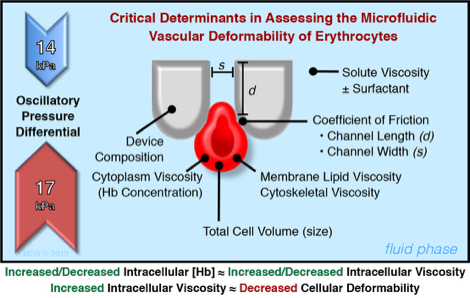
Also shown are the critical determinants in assessing the microfluidic vascular deformability of RBC when using this device.
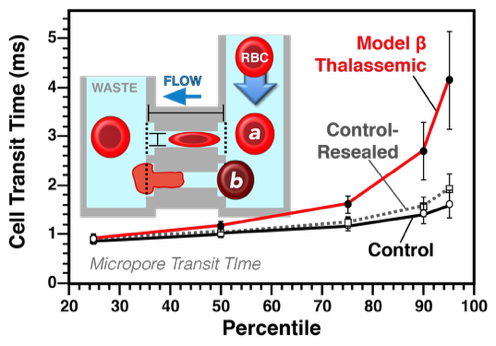
Vascular deformability of model β thalassemic RBC. The mean cell transit time (in ms) of model β thalassemic cells was significantly increased, similarly to that observed in patient samples. The cell transit analysis, an early microfluidic device, best approximates capillary flow as it requires active deformation.
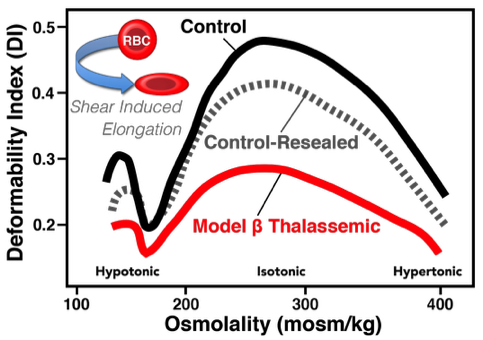
Vascular deformability of model β thalassemic RBC. Ektacytometric analysis of α-chain loaded RBC demonstrate that these chains dramatically reduce the sheer-induced shape change of the cell. Ektacytometry bests approximates high flow rates.
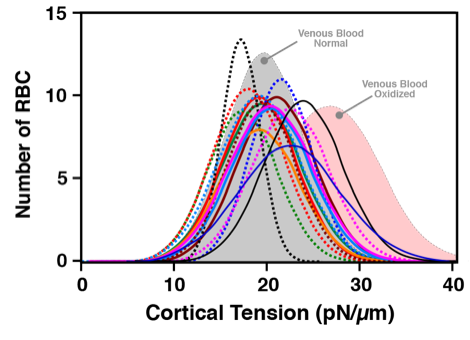
Microfluidic deformability assays of blood obtained via finger prick correlate well with venous blood findings. Shown are the individual distribution curves for the 15 finger prick donors overlaid on the venous blood draw findings for normal (grey shaded distribution curve) and oxidized (pink shaded distribution curve) RBC.
Cortical Pressure Device
Kuypers, F.A., Schott, M.A. and Scott, M.D. Phospholipid composition in model ß thalassemic erythrocytes. Am. J. Hematol., 51:45-54(1996). DOI: https://doi.org/10.1002/(sici)1096-8652(199601)51:1%3C45::aid-ajh8%3E3.0.co;2-7
Scott, M.D., Rouyer-Fessard, P., Ba, M.S., Lubin, B.H., and Beuzard, Y. α- and β-hemoglobin chain induced changes in normal erythrocyte deformability: Comparison to β thalassemia intermedia and Hb H disease. Br. J. Haem., 80:519-526(1992). DOI: https://doi.org/10.1111/j.1365-2141.1992.tb04567.x
Kwan, J.M., Guo, Q., Kyluik-Price D.L., Ma, H. and Scott, M.D. Microfluidic Analysis of Cellular Deformability of Normal and Oxidatively-Damaged Red Blood Cells. American Journal of Hematology, 88:682–689 (2013). DOI: https://doi.org/10.1002/ajh.23476